
指标名称:成交量分布指标
版本:MT4 ver. 1.32
之前发布的市场分布图不少朋友反馈不错,希望获得其它版本。
这个版本只有MT4的,MT5可以看之前版本,链接:
市场分布图,也叫成交量分布指标,也有人叫它:订单流指标,但其实这个和订单流还是有区别的,尽管很像。但用法类似,都可以研究研究。
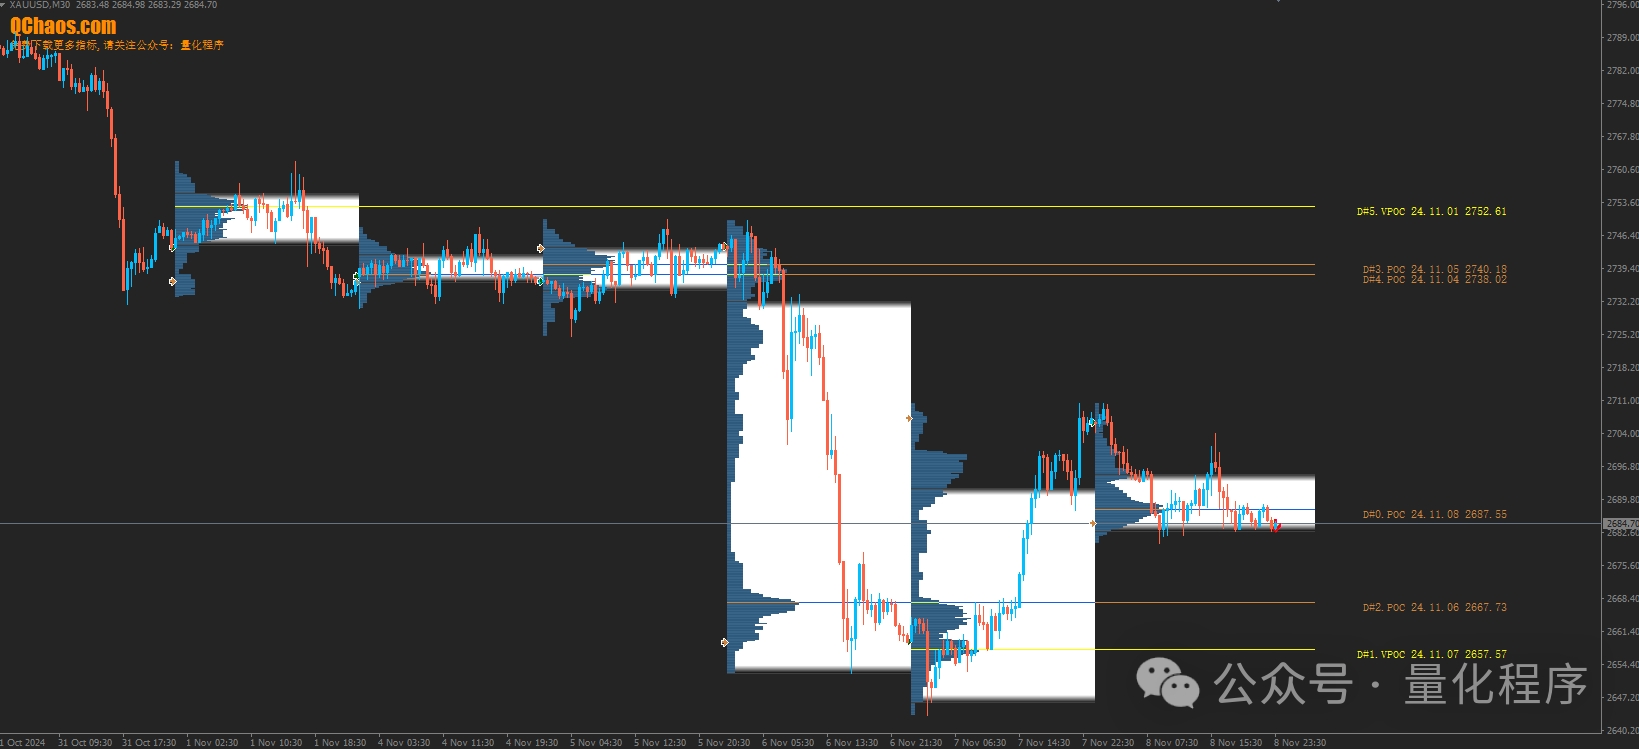
下面,我们来看看市场分布图第二版本,和之前发布的市场分布图类似,但是表现形式不一样,并且这个版本有两个版本,其中一个带箭头提示。
带箭头提示的版本如下:
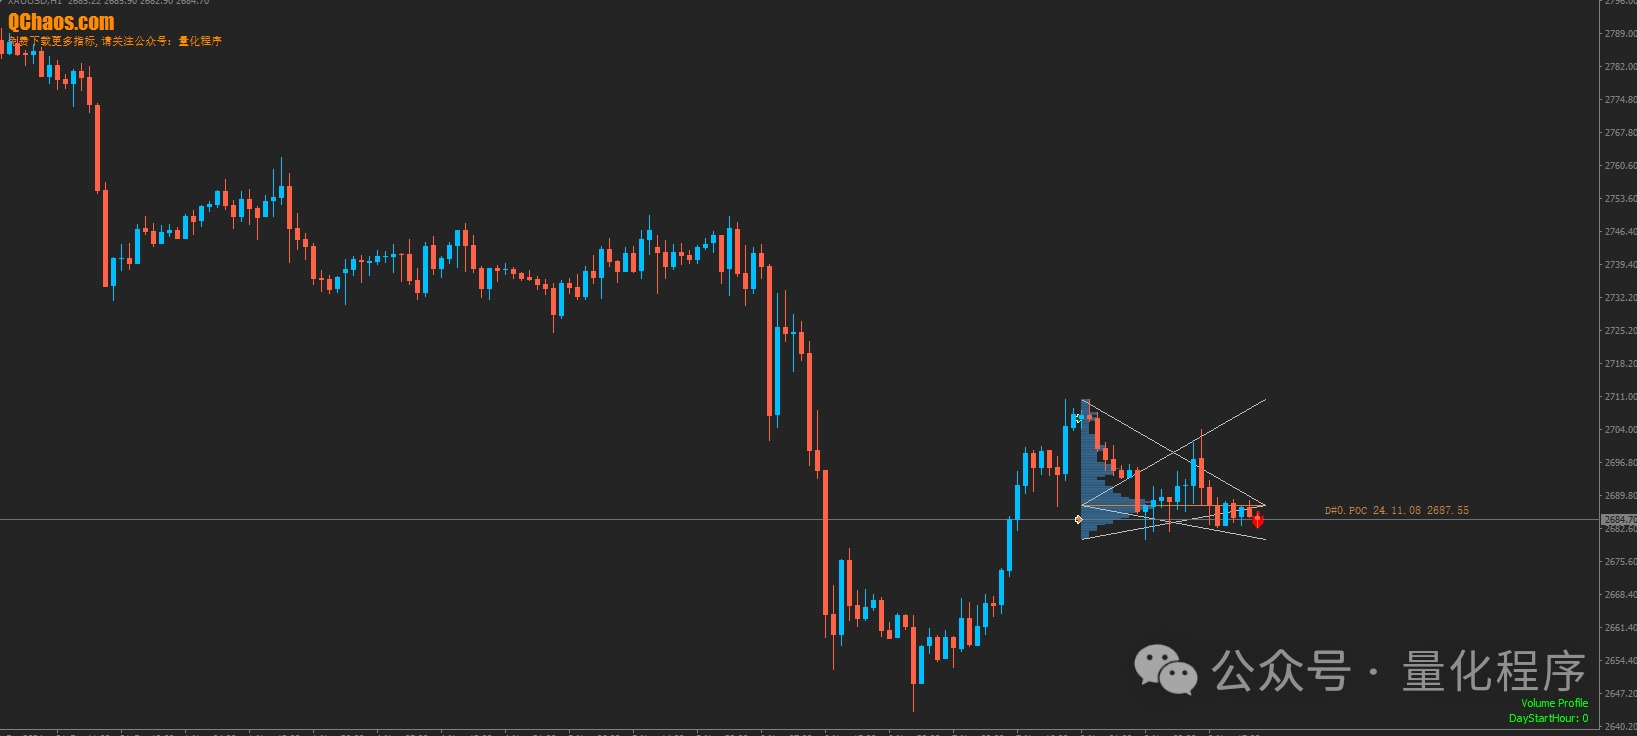
这两个版本,我都放在一起,大家慢慢学习研究。
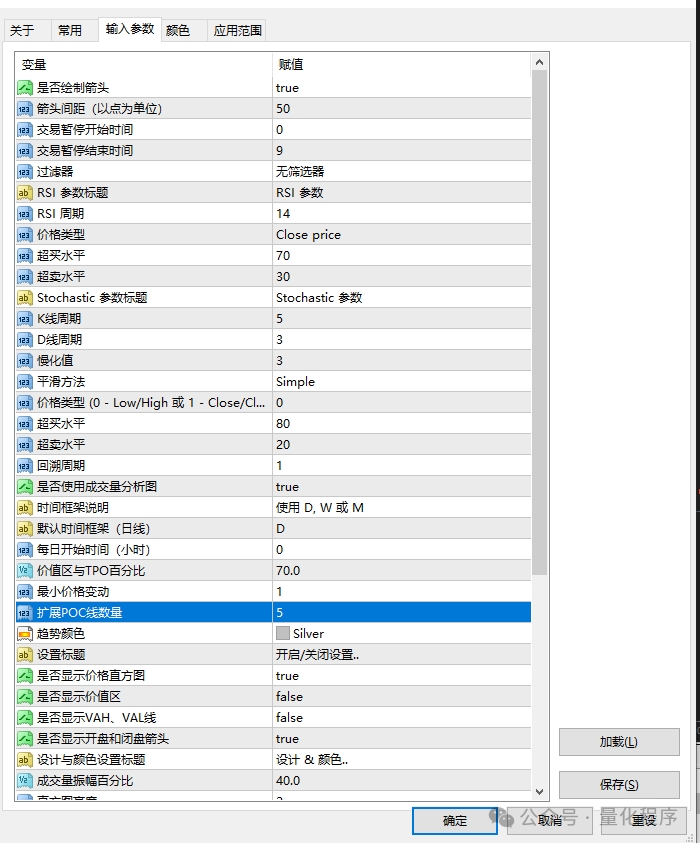
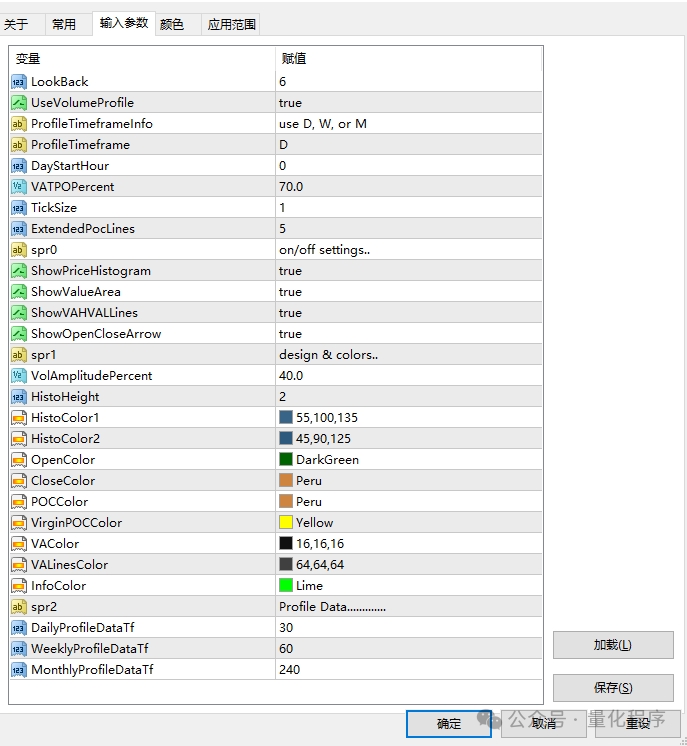
参数:
部分代码展示:
//+——————————————————————+
//| 市场分布图第二版.mq4 |
//| Copyright © 2009-2024, http://www.QChaos.com |
//| https://www.qchaos.com/ |
//+——————————————————————+
property copyright "Copyright © 量化混沌, http://www.qchaos.com"
property link "https://www.qchaos.com"
property version "1.32"
property description "———————————————"
property description "EA、指标公式分享"
property description "EA、指标编写业务承接"
property description "———————————————"
property description "更多资源,关注公众号:量化程序"
property description "微 信:QChaos001"
property description "手机号:134-8068-5281"
property description "———————————————"
property indicator_chart_window
define PRICEIDX 0
define TPOIDX 1
define VOLIDX 2
//—extern vars
extern int LookBack = 6;
extern bool UseVolumeProfile = true;
extern string ProfileTimeframeInfo = "use D, W, or M";
extern string ProfileTimeframe = "D";
extern int DayStartHour = 0;
extern double VATPOPercent = 70.0;
extern int TickSize = 1;
extern int ExtendedPocLines = 5;
extern string spr0 = "on/off settings..";
extern bool ShowPriceHistogram = true;
extern bool ShowValueArea = true;
extern bool ShowVAHVALLines = true;
extern bool ShowOpenCloseArrow = true;
extern string spr1 = "design & colors..";
extern double VolAmplitudePercent = 40.0;
extern int HistoHeight = 2;
extern color HistoColor1 = C’55,100,135′;
extern color HistoColor2 = C’45,90,125′;
extern color OpenColor = DarkGreen;
extern color CloseColor = Peru;
extern color POCColor = Peru;
extern color VirginPOCColor = Yellow;
extern color VAColor = C’16,16,16′;
extern color VALinesColor = C’64,64,64′;
extern color InfoColor = Lime;
extern string spr2 = "Profile Data………….";
extern int DailyProfileDataTf = 30;
extern int WeeklyProfileDataTf = 60;
extern int MonthlyProfileDataTf = 240;
//—global vars
string gsPref = "qc.mp.";
double fpoint
, gdOneTick
, gdHistoRange;
int fdigits
, giStep
, giProfileTf = PERIOD_D1
, giDataTf = 0;
//+——————————————————————+
//| Custom indicator initialization function |
//+——————————————————————+
int init()
{
giDataTf = Period(); //default
if (Point == 0.001 || Point == 0.00001)
{ fpoint = Point*10; fdigits = Digits – 1; }
else
{ fpoint = Point; fdigits = Digits; }
if (ProfileTimeframe == "M" )
{
gsPref = gsPref + "20" + ProfileTimeframe + "_";
giProfileTf = PERIOD_MN1;
HistoHeight = MathMax(HistoHeight, 8);
giDataTf = MonthlyProfileDataTf;
}
else if (ProfileTimeframe == "W" )
{
gsPref = gsPref + "30" + ProfileTimeframe + "_";
giProfileTf = PERIOD_W1;
HistoHeight = MathMax(HistoHeight, 3);
giDataTf = WeeklyProfileDataTf;
}
else //default D1
{
gsPref = gsPref + "40" + ProfileTimeframe + "_";
giProfileTf = PERIOD_D1;
HistoHeight = MathMax(HistoHeight, 1);
giDataTf = DailyProfileDataTf;
}
//—-
HistoHeight = MathMax(HistoHeight, TickSize);
gdOneTick = TickSize/(MathPow(10,fdigits));
gdHistoRange = HistoHeight/(MathPow(10,fdigits));
giStep = HistoHeight;
return(0);
}
//+——————————————————————+
//| Custom indicator deinitialization function |
//+——————————————————————+
int deinit()
{
delObjs();
return(0);
}
//+——————————————————————+
//| Custom indicator iteration function |
//+——————————————————————+
int start()
{
if ( !isOK() ) return(0);
LookBack = MathMin( LookBack, iBarShift(NULL, giProfileTf, Time[Bars-1]) – 1 );
LookBack = MathMin( LookBack, iBarShift(NULL, giProfileTf, iTime(NULL, giDataTf, iBars(NULL, giDataTf) – 1)) );
int ibarproftf = 0, endbarproftf = 0;
//—create all profile on startup/new tfsrc bar
//—and then only update the last tfsrc profile
if ( newBarProfileTf() ) { delObjs(); endbarproftf = LookBack-1; }
double apricestep[][3] // [ 3–>{price, count tpo, count vol} ]
, hh, ll // profile
, maxvol
, vah // Value Area High
, val // Value Area Low
, totaltpo // Total TPO
, totalvol; // Total Vol
datetime dtproftf;
int startbar // startbar on giDataTf
, endbar // endbar on giDataTf
, countps
, vahidx
, validx
, maxtpo
, maxtpoidx
, maxvolidx;
//—main loop –> day by day, week by week, month by month…
for (ibarproftf = endbarproftf; ibarproftf >= 0; ibarproftf–)
{
ArrayResize(apricestep, 0);
getStartAndEndBar(ibarproftf, startbar, endbar);
if (startbar == -1) continue;
getHHLL(startbar, endbar, hh, ll);
getPriceTPO
( startbar, endbar, hh, ll, apricestep, countps, maxtpo,
maxtpoidx, totaltpo, maxvol, maxvolidx, totalvol );
//continue;
drawPriceHistoAndPOCLines
( startbar, endbar, ibarproftf, countps, apricestep, maxtpo,
maxtpoidx, maxvol, maxvolidx );
//continue;
getValueArea
( countps, apricestep, maxtpo, maxtpoidx, totaltpo, maxvol,
maxvolidx, totalvol, vah, vahidx, val, validx );
//continue;
drawValueArea
( startbar, endbar, ibarproftf, countps, apricestep, vah,
vahidx, val, validx );
}//end for (ibartf = endbartf; ibartf >= 0; ibartf–)
//update time ExtendedPocLines
if (newBar())
{
for (int i=1; i<=ExtendedPocLines; i++)
{
ObjectSet(gsPref + "#" + i +".1.1.poc", OBJPROP_TIME2, Time[0] + 10Period()60 );
ObjectSet(gsPref + "#" + i +".1.0.poc.price", OBJPROP_TIME1, Time[0] + 13Period()60 );
}
}